Building and Testing a Model
This project focused on Snapchat political ads and ML.
Targeted Advertising in Snapchat Political Ads
Cyril Gorlla. Analysis of Targeted Advertising in Snapchat Political Ads. 2021. ⟨hal-03217648⟩
Predicting Ad Spending on Snapchat
Cyril Gorlla. Predicting Political Ad Spending on Snapchat. 2021. ⟨hal-03217649⟩
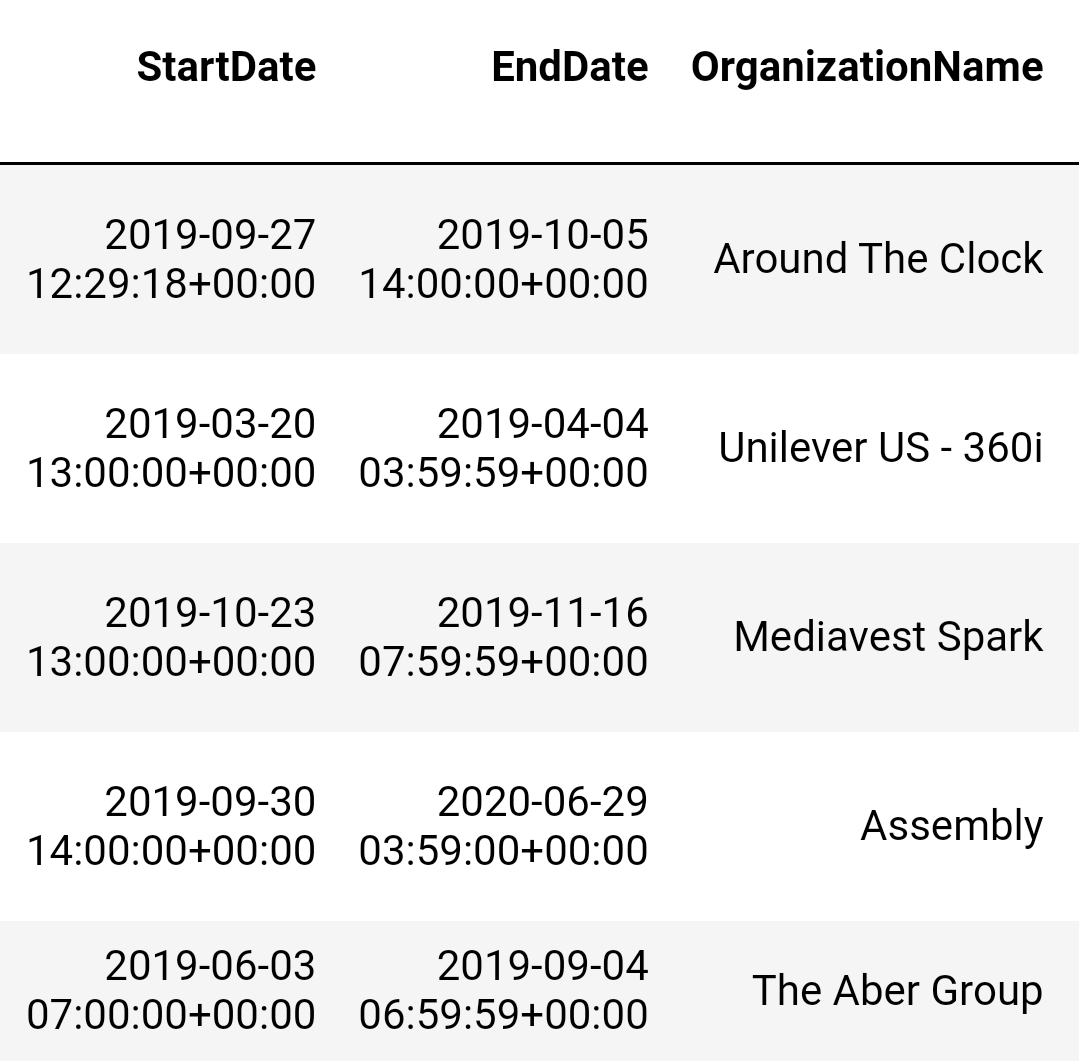
The Data
Snapchat is one of the most popular social media platforms in the world, capturing the attention of a younger demographic in comparison to other platforms. As such, advertising on the platform is an incredibly lucrative business, with the company making billions from advertising alone. A particular area of advertising that can be of interest to the general public is that of political advertising—ads run by political campaigns, PACs, special interest groups, or other similar entities. The spending patterns of these groups can reveal important insights about which communities are being targeted by political advertising and which candidates are advertising where. Snapchat publishes the data for all political ads run on the platform in an effort to increase transparency on the platform.
The Problem
There are hundreds of thousands of political ads run on Snapchat every year in the US alone. It is impractical to gain any insights on this data from manual analysis as this would take multiple people working many hours to comb through hundreds of thousands of rows in the data. This is where today's computing power comes in. These technologies allow us to process data that would take exponentially more time to analyze by hand.
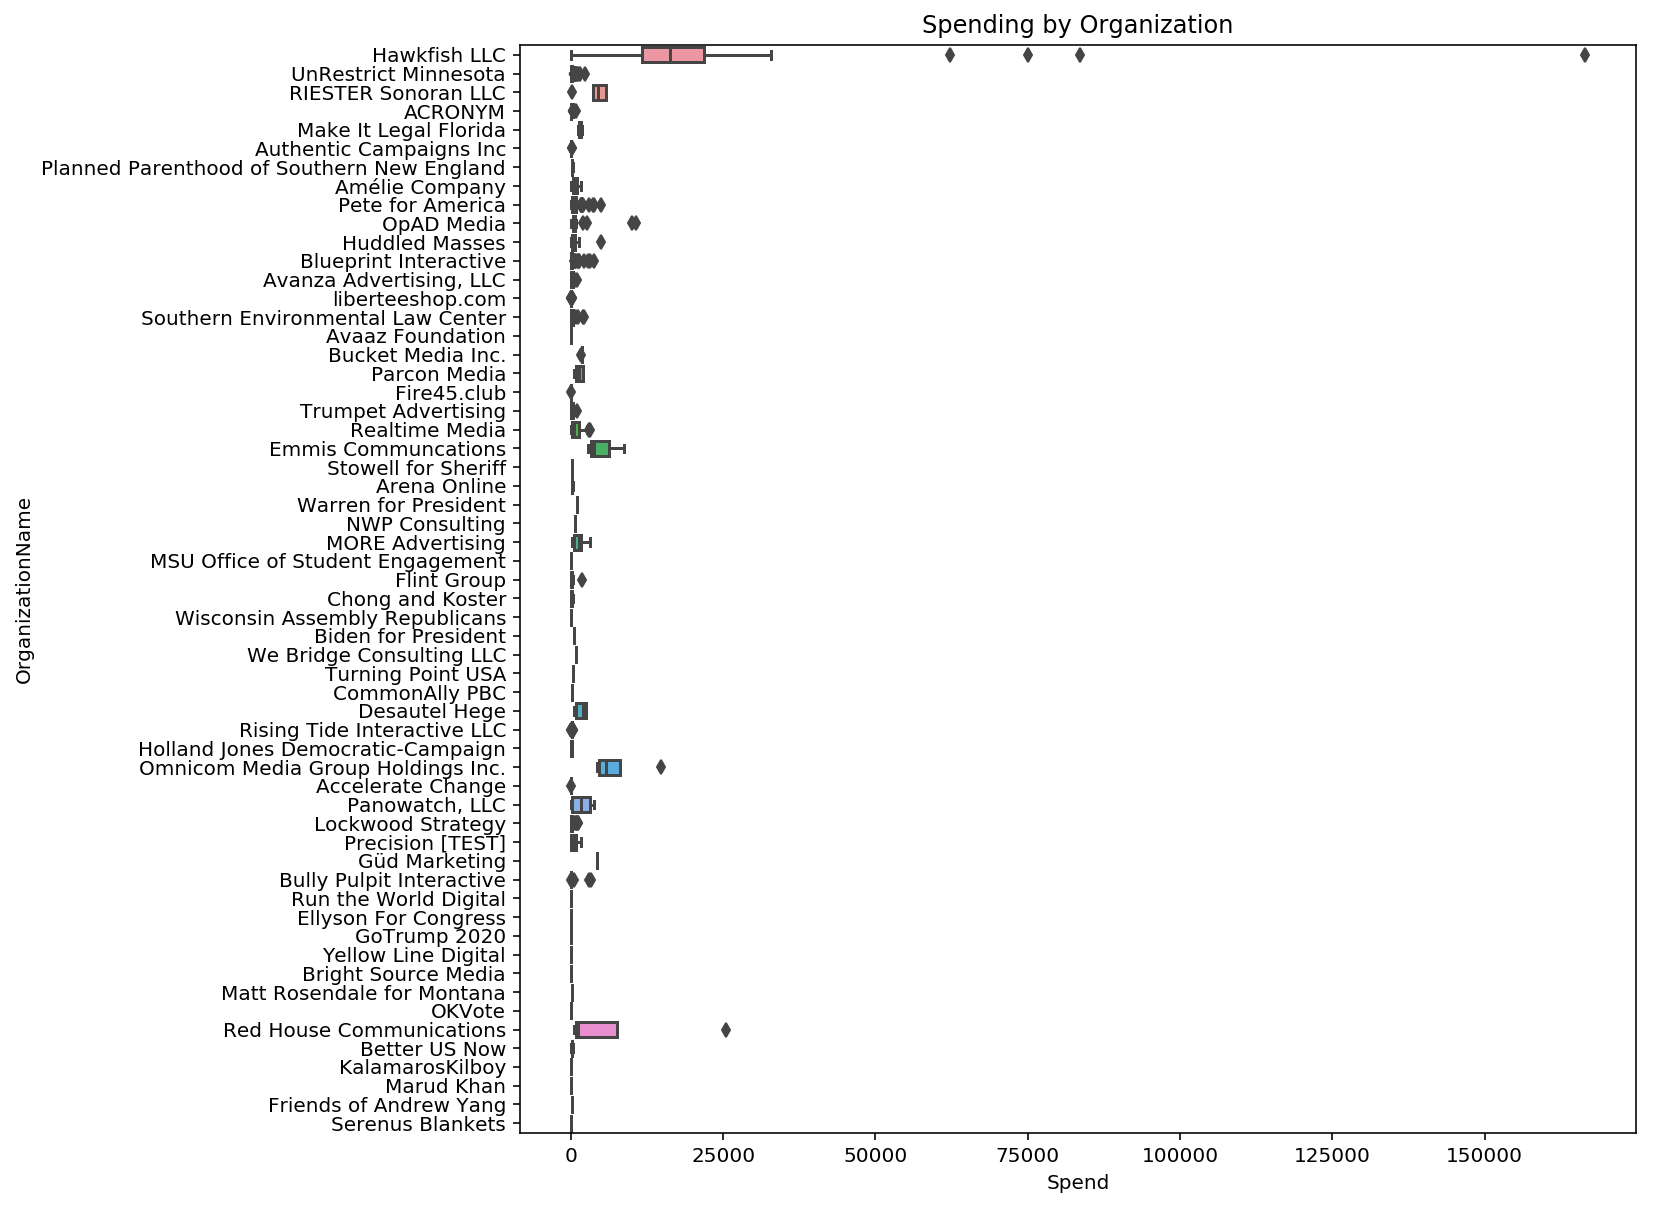
The Analysis
Analyzing the data, we find many interesting insights. We can identify the advertisers which spend the most (Mike Bloomberg's campaign makes an appearance) as well as seeing the geographical distribution of spending.
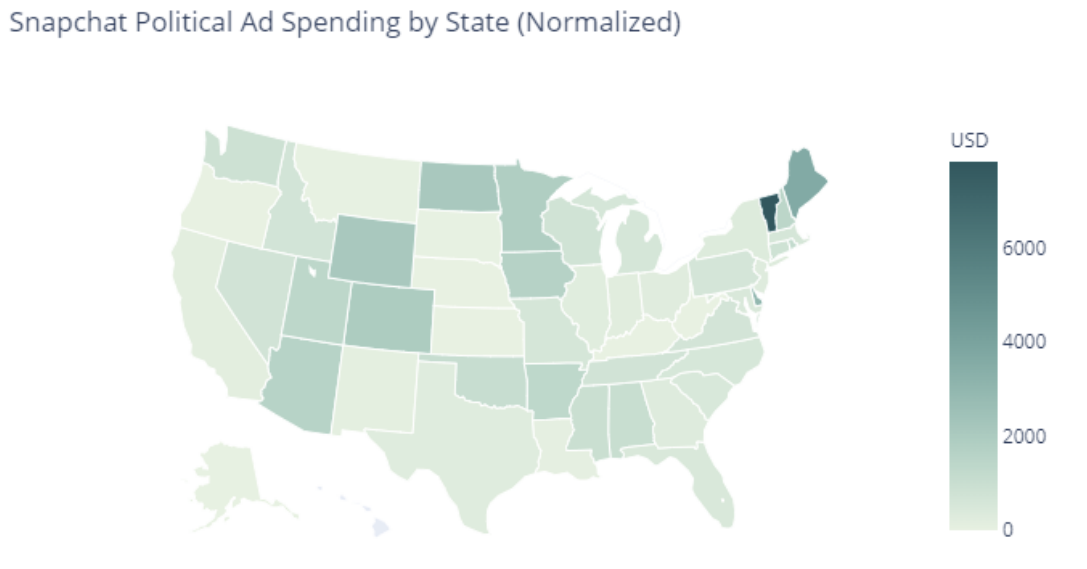
Obviously, using the raw amounts spent in each state is not going to yield meaningful information as these amounts will be biased by each state's population. We can use population data from the Census Bureau to normalize the spending in each state, and we can see that Vermont has a disproportionate amount spent in it.
Predicting Ad Spending
So we've now analyzed the data, but what if we want to predict these trends? We can use artificial intelligence and machine learning for this task. We first start with a simple linear regression model and see how well it performs with R², or goodness of fit. This is a measure of how well our model replicates the patterns in the data. Initially, we achieved a R² of .66, which is not great. However, after feature engineering (manipulating and optimizing the inputs to our model to improve performance), we find that our R² improves to .84, which is a significant improvement.
We've seen how ML & AI can be applicable to political issues of civic interest. We can identify areas of anomalous spending by political organizations as well as develop models to predict these patterns of spending.